Back to Top
PROJECTS
Sonatype BOM Doctor: Diagnosing risky dependencies faster
Workflow
Workshop Facilitation
User research synthesis
Wireframes & low-fidelity flows
Tree graph design exploration
Prototypes & dev handoff
Team
Product Designer (x1)
Tech Lead (x1)
Sales Engineers (x2)
DevRel (x2)
Time
2022
Product
Sonatype BOM Doctor
Metrics
3 month
time to MVP
80%
usability feedback
6x
design iterations
Diagnosing the Real Problem
During user interviews and sessions with internal DevRel and Sales Engineering teams, we uncovered a key insight: developers aren’t always security-focused, but they are solution-focused. They want actionable feedback without needing to consult others or dig through documentation.
“I just want to know what to fix—and not break my app in the process.”
— Internal developer, user interview session
Choosing the Right Dependency View
We tested three ways to represent dependencies and evaluated each for clarity, hierarchy, and performance.

List View
Pros
Cons
No hierarchy

Tree List
Pros
Cons

Tree Graph
Pros
Cons
“We selected the Tree Graph for its ability to show one instance per component and highlight circular dependencies without repetition.”
Exploring Early Ideas
We moved into wireframing and testing ways to visualize and simplify complex dependency data.

Brainstorming Tree Graph Structures
Mapped early ideas for visualizing dependencies, hierarchy, and circular relationships.

Simplifying the Tree Graph Layout
Refined layout to improve clarity, reduce duplication, and surface risky components.

Component Summary Panel
Explored ways to display detailed information and remediation actions for selected dependencies.
Designing and Delivering the MVP
We tested and refined different graph layouts to help developers spot circular dependencies and reduce confusion


Launching the MVP version
- Refined UI to highlight circular dependencies clearly
- Validated interaction patterns with internal testers
- Delivered a working MVP within 3 months under tight deadlines
Key Outcomes
From initial concept to functional MVP, here’s what we achieved and why it mattered.
MVP Delivered in 3 Months
Achieved by aligning tightly scoped sprints across design and engineering
Tree Graph Validated
Preferred over list/tree views during internal usability walkthroughs
Developer-Centric UX
Enabled self-service remediation with actionable project health insights
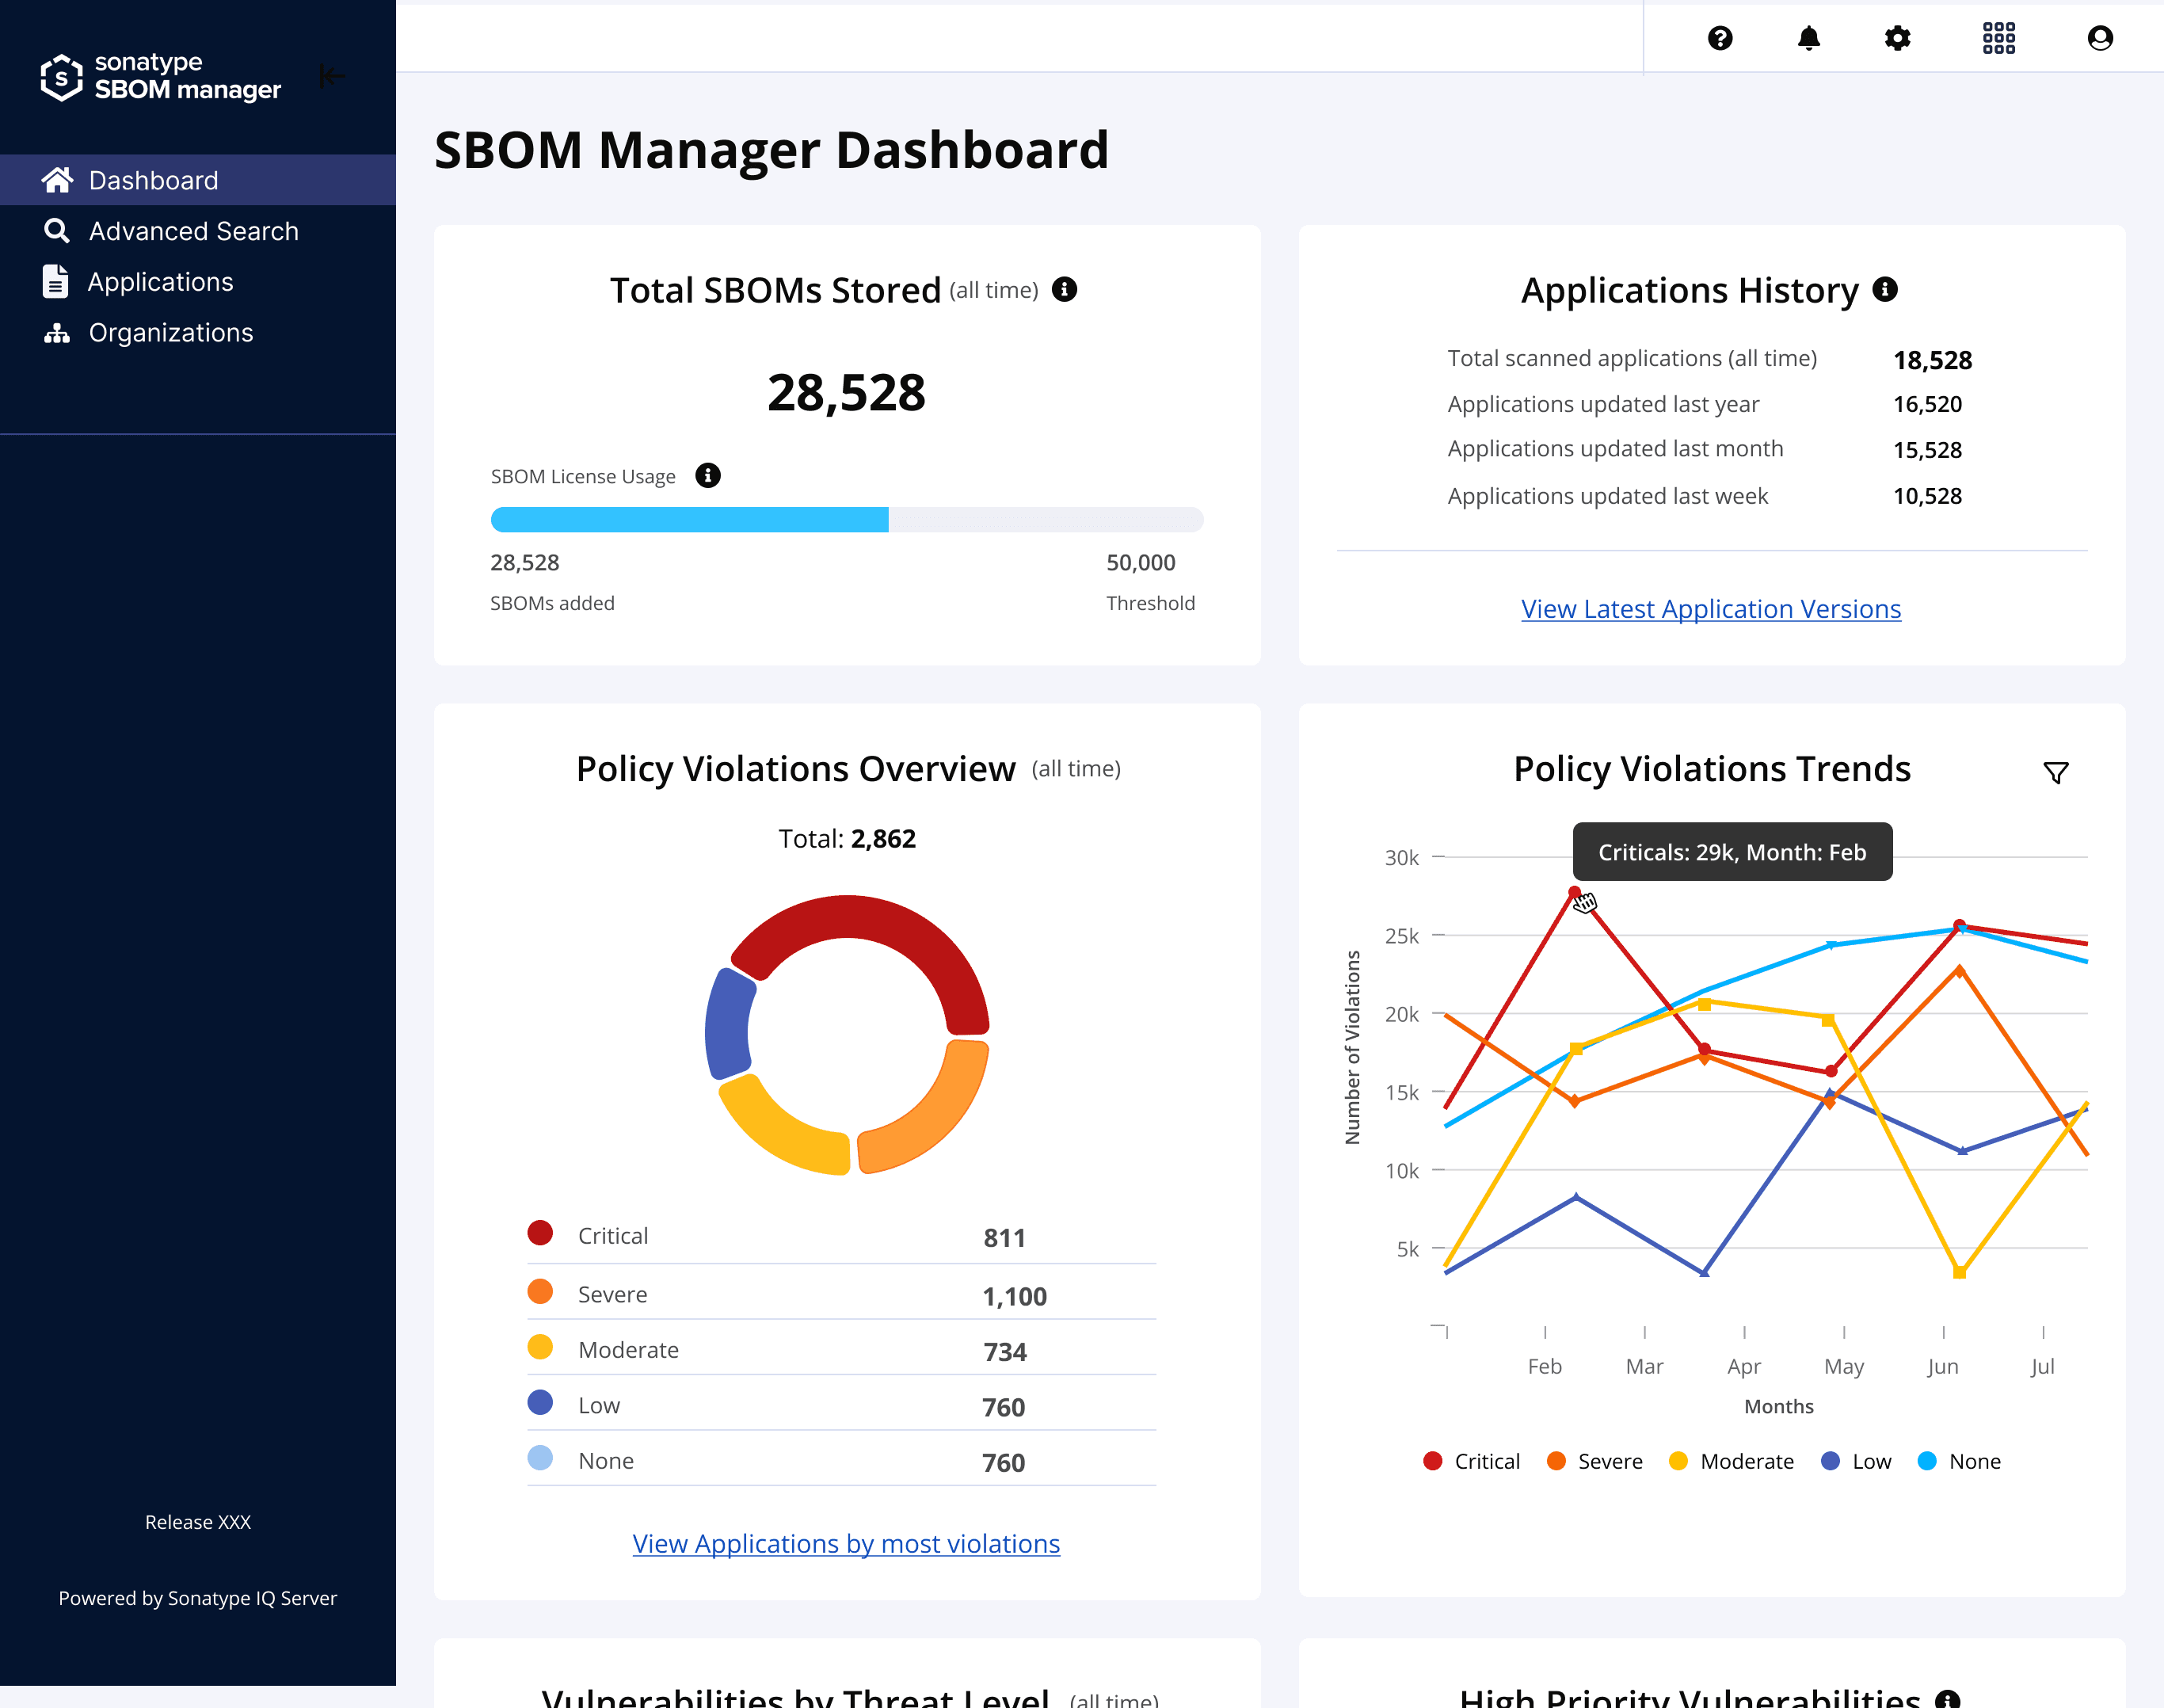
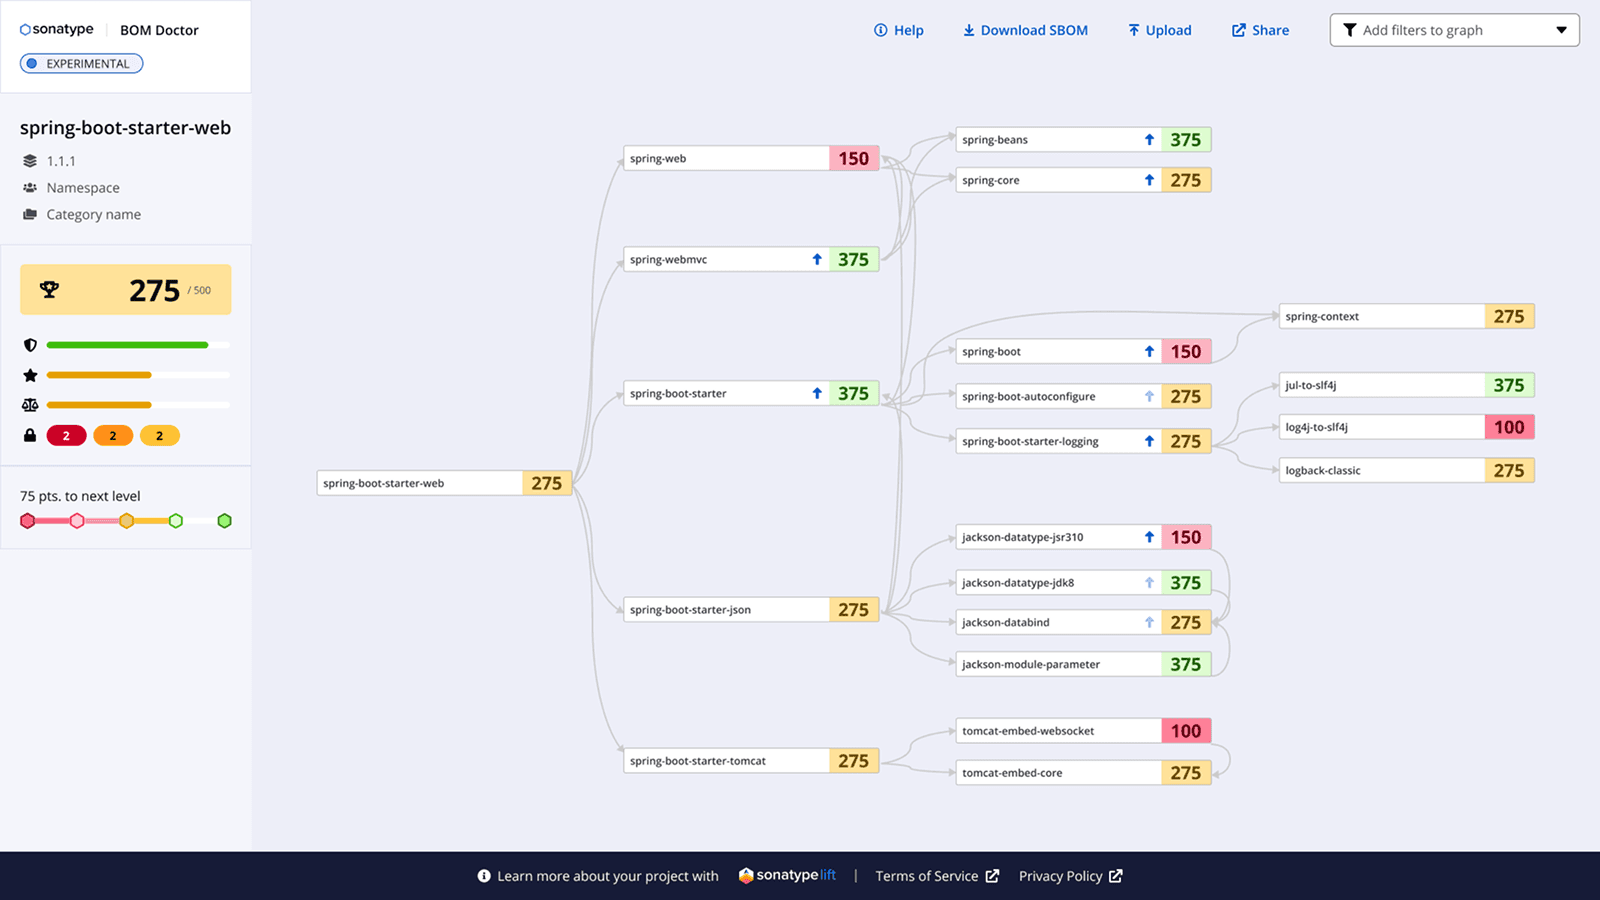
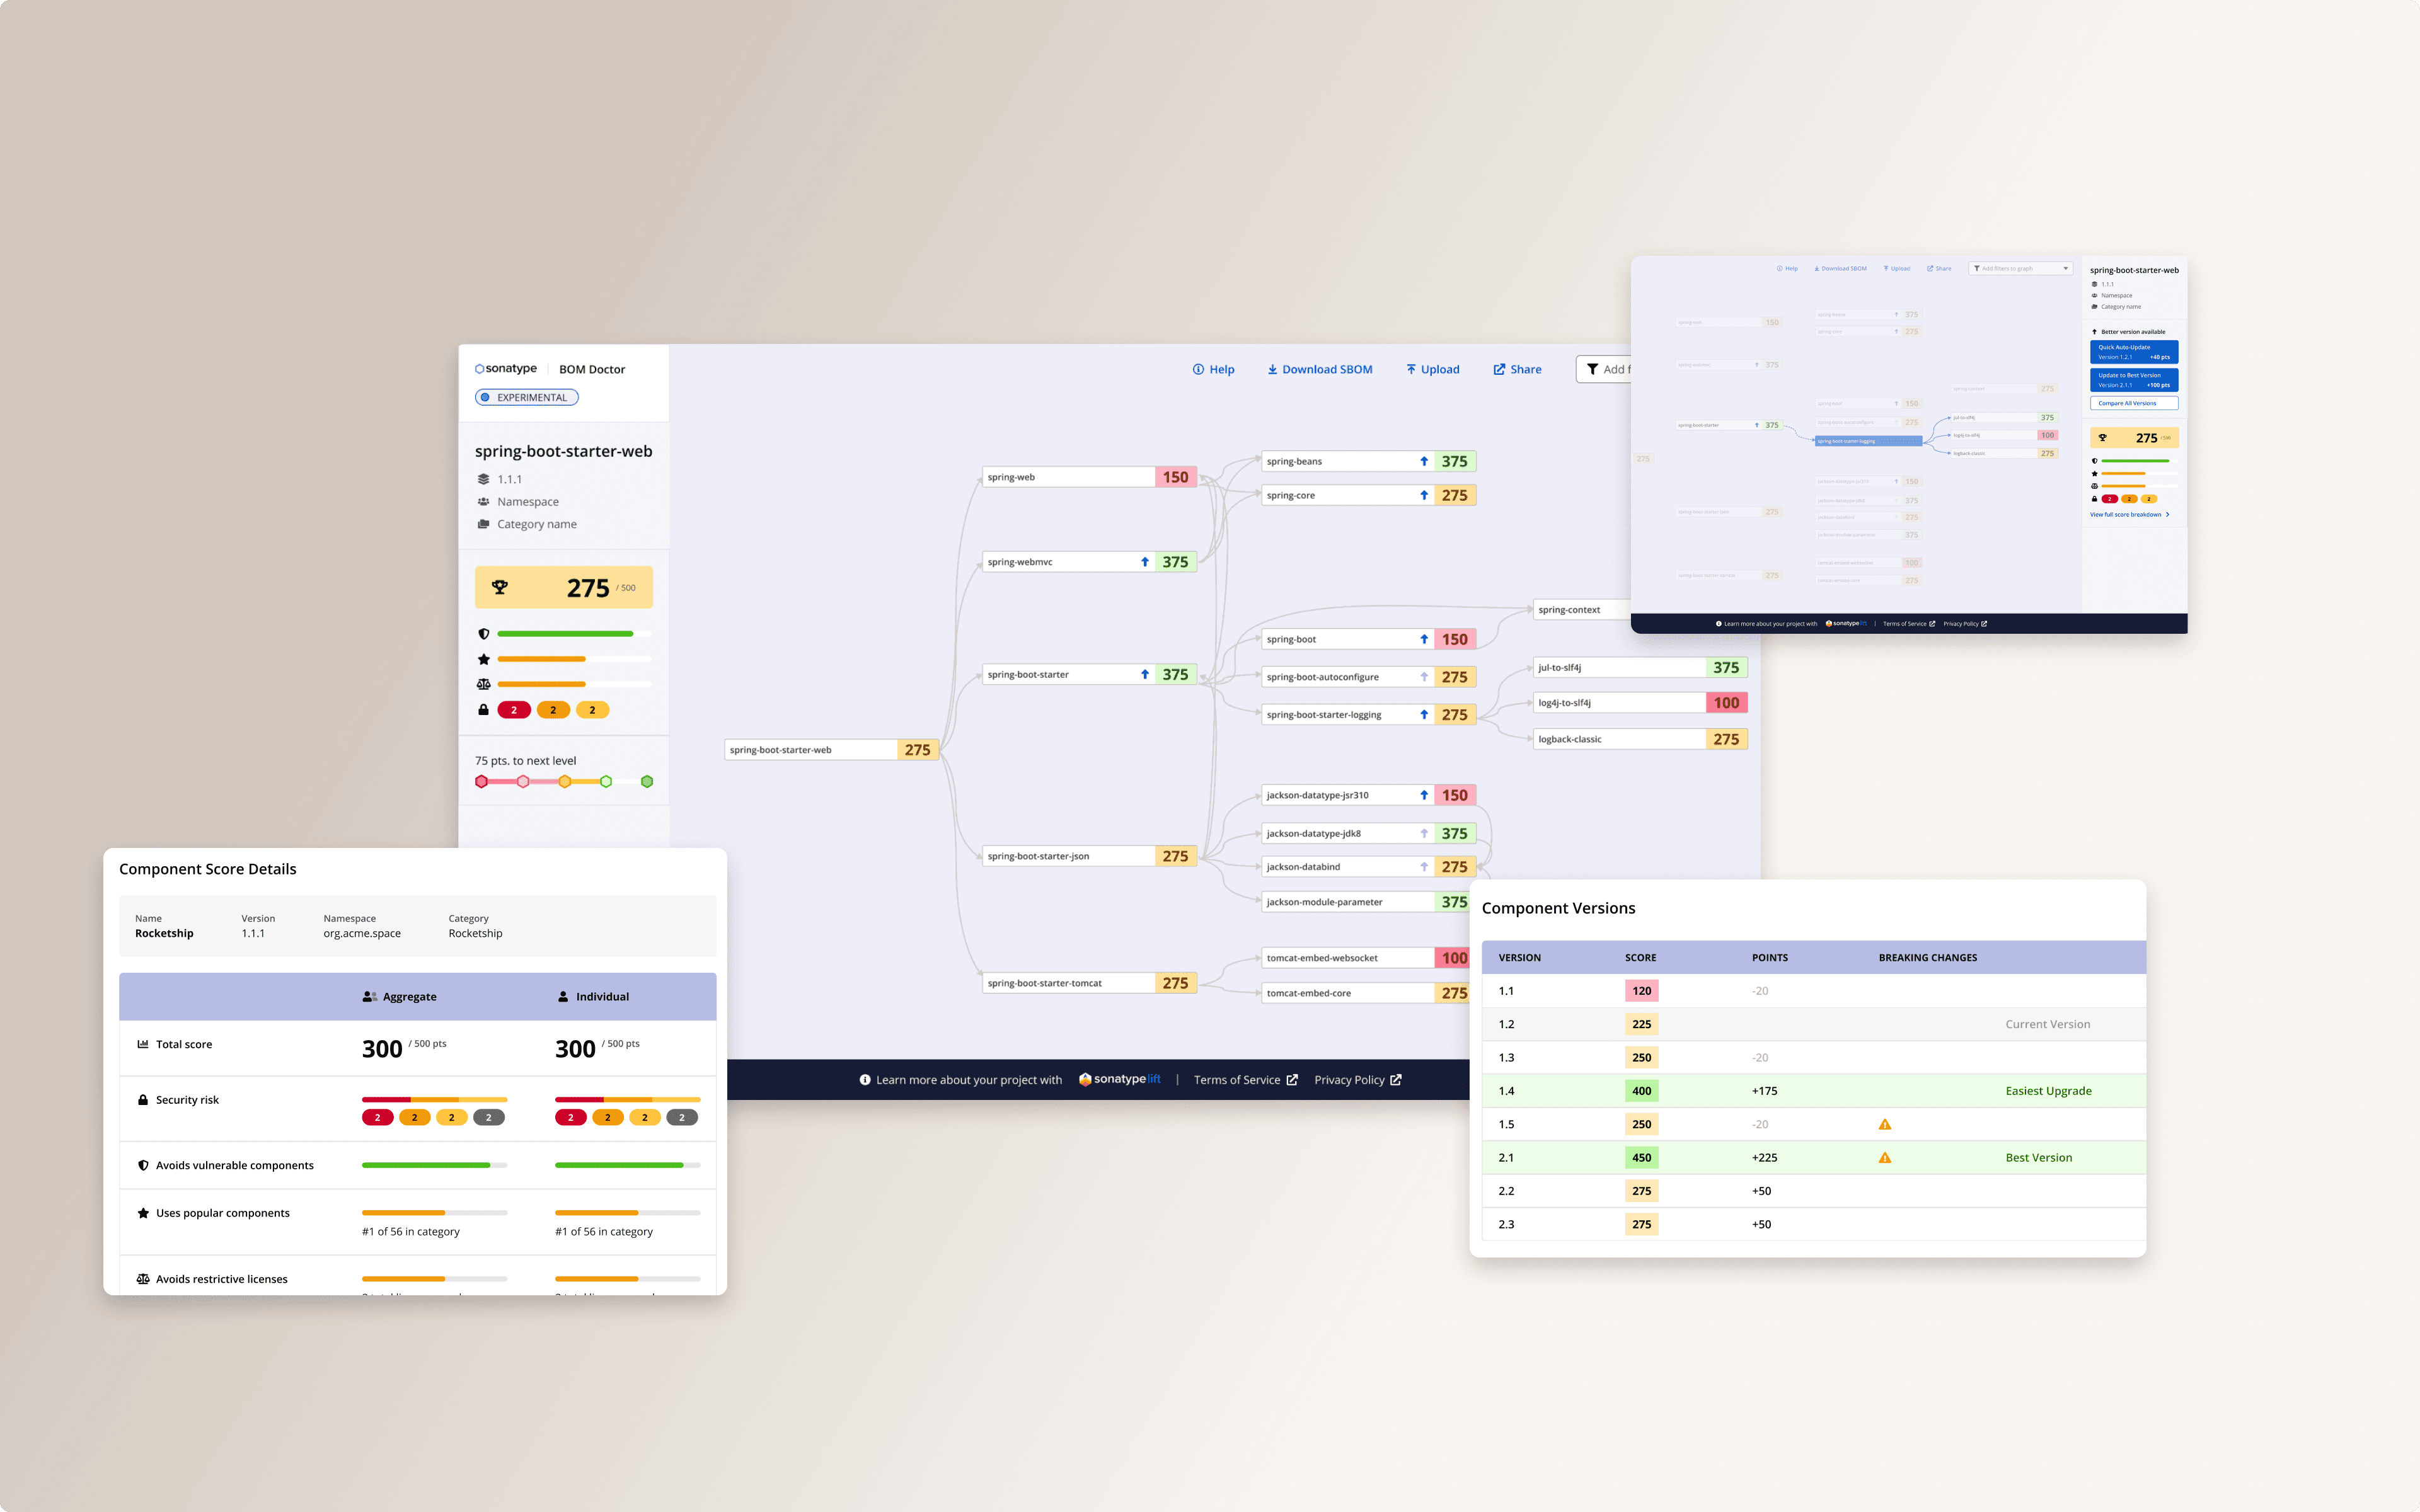
Final Design Snapshots
Polished views of the MVP interface that helped developers prioritize project health.

Tree Graph
Visualizes dependencies and circular relationships

Component Detail
Component-level risk and version suggestions

PDF Report
Exportable report to guide remediation